
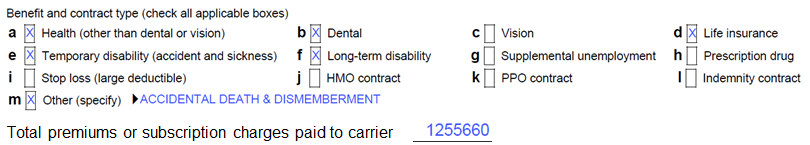
I’ve been working with 5500 data for the last 16 years. In that time I have come to appreciate both its value as well as its limitations. One of those limitations has always been how to handle multi-line insurance policies. This is one of those things that is perhaps better explained with a visual. Below is a typical insurance policy found on a 5500.
Data Collection Methodology
These insurance policies (commonly known as “Schedule A’s”) are created, filled out by the insurance company, and sent over to the plan sponsor to be filed along with their 5500. The insurance company checks off the boxes, as we see above, to indicate what kind of insurance coverages are offered as a part of this policy. So far so good, right? A problem arises in that although there can be many different coverages, there is only a single dollar figure to represent the premiums collected by the insurance company.
Why is this an issue? Looking across multiple policies to figure out how much an insurance carrier is collecting for a specific type of coverage is impossible. How much dental coverage does MetLife write? We don’t know and we can’t know. It is too often mixed in with life coverage. The situation gets even worse for big carriers like Aetna and Cigna who offer health insurance as well as life, dental, etc…
Breaking the Data Apart
After years of grappling with the issue, we finally found a solution. With the help of some friendly insurance carriers who prefer to remain nameless, we developed a model that allows us to break apart these multi-line policies. We call these “modeled premiums.” Our testing shows these models are accurate to within 10% of what the carrier themselves recognizes in premiums. We’ve successfully modeled premiums for Health, Life, Dental, Vision, STD, and LTD coverages.
Modeled premiums have been live in our Group Insurance tool for nearly a year. Because of their popularity, at the beginning of Q2, 2019 we put them into our Brokers and Carriers Market Share database. Having the ability to recombine modeled premiums by the broker, across every 5500 on which that broker appears, gives us an entirely new way to assess the market share of brokers. Want to know who sold the most dental in California? Which carrier sold more dollars of group life coverage east of the Mississippi? Now, finally, we can tell you.
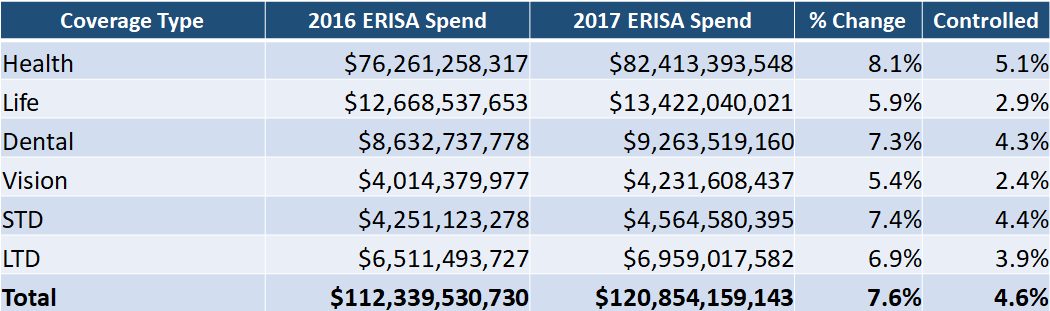
Because this has been my project for the last few years, I took the first whack at producing some original research on the subject. It includes a state-by-state and industry-by-industry breakdown of the change in overall ERISA-spend year over year, modeled out by each of our six lines of coverage. Here’s a sneak peek at one of the tables:
To download the complete report, for free, simply click here: https://www.judydiamond.com/slide-deck-state-of-the-industry/. For more information, contact us at 800-231-0669